RIPARIAN CORRIDOR MONITORING REPORT
2004
Paul Watters,
Monterey Peninsula Water Management
District
RIPARIAN CORRIDOR MONITORING REPORT
2004
Paul Watters,
Monterey Peninsula Water Management
District
Plant Moisture Stress Testing (Pre-Dawn Leaf Water
Potential)
2004 Depth to Groundwater Monitoring:
Depth to
Groundwater Values vs. Average Pre-Dawn Leaf Water Potential Values
APPENDIX A: Historical Depth
to Groundwater for Selected Monitoring Wells

I. INTRODUCTION
The mission of the Monterey Peninsula Water Management District (MPWMD)
is to manage, augment, and protect water resources for the benefit of the
community and the environment. MPWMD is
an independent Special District created by an act of the
Since the early 1980s, MPWMD has integrated water supply management with
an active program to mitigate for the impacts from water extraction including restoration
of degraded natural resources in the
Over the last century, the
An absence of major flood damage between the 1911 flood (estimated to be
20,000 cubic feet per second) and the 1958 flood allowed for encroachment of development
into the floodplain. Increased demands
on groundwater beginning in the 1960’s in conjunction with a severe two-year
drought in1976 and 1977 put an enormous amount of pressure on the limited water
resources in
In studies
contracted by the MPWMD, a negative correlation was demonstrated between
groundwater pumping and the health of the riparian vegetation. This means that
with increased groundwater pumping, the health of the riparian vegetation would
decrease, and vice-versa: less groundwater pumping will increase the health of
the riparian vegetation, of which is essential to channel stability (McNiesh,
1986, ’88, ’99, ‘91a, ‘91b). It was
determined that plant stress was directly related to soil water availability
and depth to groundwater. It was recommended that mitigation was necessary in
the form of irrigation if all four of the following criteria were met (McNiesh,
1986):
1.
Dry river channel
2.
Drop in the water table by greater than 2 feet per
week or seasonally, 8 feet or more below the elevation of the river channel
3.
Unacceptable soil moisture levels
4.
Unacceptable vegetation stress
To determine these conditions
MPWMD developed a monitoring system, currently in use, to measures plant
stress, soil moisture, and depth to groundwater. When necessary, supplemental irrigation is
applied to help mitigate the effects of unacceptable vegetation stress.
This report summarizes 2004
monitoring methods and results.
The 36-mile-long
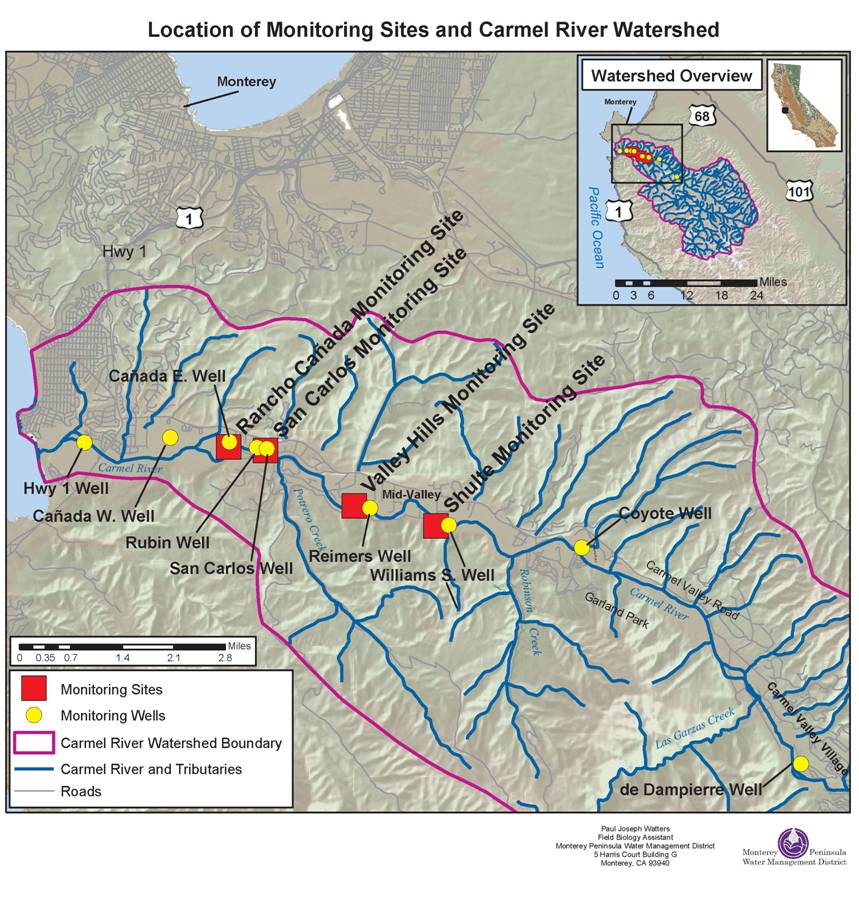
Figure 1. The four
vegetation monitoring sites and the
The Rancho Cañada monitoring site is located 3.24 miles upstream
of the
The igation at this site began in 1989 to offset impacts
to riparian vegetation. The
The Valley Hills monitoring site is located 5.60
miles upstream of the
The Schulte
river monitoring site is located 6.70 miles upstream of the
For this
report, eight wells are monitored for depth to groundwater (Table 1) with an
Olympic Well Probe model 150. Five monitoring wells are used to characterize
the depth to groundwater within the lower portion of the
For this
report, depth to groundwater data is collected every two weeks from May through
October, but other MPWMD personnel monitor some of these wells in addition to
many other wells year round on a monthly interval. Data from one of these wells
‘Williams South’ was chosen for use in this report to show depth to groundwater
near the Valley Hills monitoring site, bringing the number of wells referred to
in this report to a total of nine.
For the 2004
season, depth to groundwater monitoring began on May 7, 2004. The monitoring alternated bi-monthly between
downstream well stations (
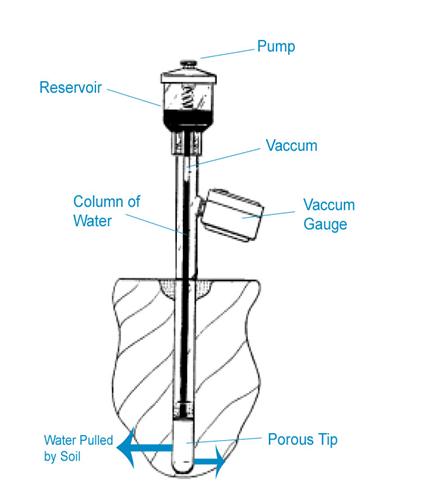 Tensiometers (Figure 2) are used at three vegetation monitoring
sites (
Tensiometers (Figure 2) are used at three vegetation monitoring
sites (
The
tensiometers used have two different lengths (18” & 36” below the surface),
and are buried in pairs (one station contains one pair of each; 18” and 36”) so
that the perforated ends are placed at 18 inches and 36 inches below the
surface. These stations are located at different elevations above the river in
order to measure soil moisture at that elevation.
Maintenance
of tensiometers includes pumping of algaecide treated water into the column and
refilling the reservoirs at least once every two weeks, generally done after
readings are taken.
Selected
trees at the four monitoring sites are monitored bi-monthly through the dry
season, which typically extends from May through October, for moisture stress. A total of 14 red willows (Salix
laevigata) and 13 black cottonwoods (Populus trichocarpa balsamifera)
are sampled every two weeks. The selected trees have been removed from
surrounding irrigation systems, except for four ‘control’ trees; one of each
cottonwood and willow at both the Schulte and Valley Hills restoration sites.
The data collected from trees shows the water stress of specific sample trees,
giving an indication of moisture stress in the surrounding area.
The trees’
moisture stress is quantified through the use of a PMS Instruments Model 670 pressure
bomb (plant water status 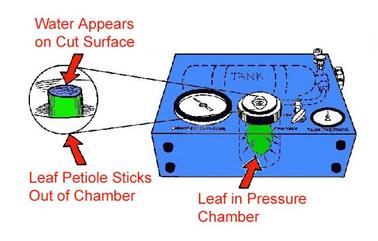 console) using the following methods: First, newer-growth
leaves are collected from specified trees in the pre-dawn hours for a single
monitoring site. Next, for each leaf, a clean cross-sectional slice is made
across the petiole of the leaf. The leaf petiole is fit tightly, cut side up,
into a rubber stopper and then sealed with ‘silly’ putty. Then, the leaf is placed within the model
670’s nitrogen pressure chamber with the petiole sticking out of the pressure
chamber within view of the operator. The operator slowly increases the pressure
in the chamber while simultaneously observing the tip of the petiole with a
hand-lens. When the operator observes water being forced out of the petiole
(leaf), the operator immediately stops increasing the pressure and records the
pressure in the chamber as it reads on the model 670’s dial gauge (bars). The
above method is then performed for all leaves within several minutes of their
collection.
console) using the following methods: First, newer-growth
leaves are collected from specified trees in the pre-dawn hours for a single
monitoring site. Next, for each leaf, a clean cross-sectional slice is made
across the petiole of the leaf. The leaf petiole is fit tightly, cut side up,
into a rubber stopper and then sealed with ‘silly’ putty. Then, the leaf is placed within the model
670’s nitrogen pressure chamber with the petiole sticking out of the pressure
chamber within view of the operator. The operator slowly increases the pressure
in the chamber while simultaneously observing the tip of the petiole with a
hand-lens. When the operator observes water being forced out of the petiole
(leaf), the operator immediately stops increasing the pressure and records the
pressure in the chamber as it reads on the model 670’s dial gauge (bars). The
above method is then performed for all leaves within several minutes of their
collection.
The above is
performed before dawn when stomata are closed and water in the leaf is a
function of available soil moisture (McNiesh, 1988). The greater the pressure required to force
moisture from the tree leaf, the more stress the tree is experiencing; the amount
of pressure it takes to force the free water from the petiole is a measure of
the amount of water available within the plant for ![]() life processes.
The established laboratory stress index stated in the Woodhouse study shows
that “severe” stress is recognized when the results for willows rise above 7.5
bars and when readings for cottonwoods rise above 10.0 bars (Woodhouse,
1983). Woodhouse recommends, “Irrigation
should begin when pre-dawn water potential falls to within two bars of these
critical values.”
life processes.
The established laboratory stress index stated in the Woodhouse study shows
that “severe” stress is recognized when the results for willows rise above 7.5
bars and when readings for cottonwoods rise above 10.0 bars (Woodhouse,
1983). Woodhouse recommends, “Irrigation
should begin when pre-dawn water potential falls to within two bars of these
critical values.”
In order to
show the effects of irrigation on the trees, two ‘control’ monitoring trees,
one each of cottonwood and willow, at both the Valley Hills and Schulte sites,
were irrigated and tested for plant moisture stress. The results of plant
moisture stress testing for irrigated versus non-irrigated trees will be
compared to show the affects of irrigation.
The following monitoring wells; Cañada, Rubin, San
Carlos, and Williams South show an increase in depth to groundwater over time
especially as the river dried up in early June (Figure 4). Within a period of seven months (May through
October) the aquifer level dropped 16.35 feet overall at the Williams South
well and 22.28 feet overall at the Rancho Cañada well. Reasons for this steady drop in groundwater
values are attributed to constant pumping of Cal-Am’s production wells
resulting in the lack of recharging river flow within this reach. The streambed remained dry due to the pumping
and lack of rainfall until the first significant storms established streamflow al
the way to the Carmel River Lagoon on December 27, 2004.
In contrast to these above-mentioned monitoring
wells, the ‘upstream’ monitoring wells (at DeDampierre, Coyote, and Reimers)
show little overall change in depth to groundwater values (Figure 5). The consistent values at these upstream groundwater
level monitoring sites are a function of perennial flow, and reduced pumping of
the nearby production wells.
Figure 4.
Figure 5.
The
plot of Cal-Am’s Rancho Cañada production well verses the depth to groundwater
values at the adjacent Rubin,
Figure
6 also shows the ‘cone of depression’; a regional drop in the water table that
increases in depth as it approaches the production well. The
Figure
7 shows a steady drop in depth to groundwater at the Williams South monitoring
well, located adjacent to the cypress well. Groundwater levels dropped to over
40 feet below the wooded terrace, and remained there throughout the remainder
of the summer.
A direct relationship between municipal pumping and
depth to groundwater is illustrated in Figure 8; Shulte Well Production Vs.
Depth to Groundwater at Reimer’s well. Depth to groundwater dropped more than
4.5 feet after the river dried up through the Shulte area in July, due to
pumping at Cal Am’s Shulte production well. However, in October, production was,
for some reason or another, halved then reduced to fractions of what it had been
for the previous months. Without this extraction, the cone of depression
quickly disappeared and by the end of the month, the water table rose to levels
seen previous to the river drying.
Figure 6. Rancho Cañada Well Production Correlated with Nearby Depth to Groundwater
Figure
7.
Figure 8. Schulte Well Production Correlated with Nearby Depth to Groundwater
Tensiometer values at
The
relationship between river flow and soil moisture is demonstrated in Figure 10.
Soil tension remained low (soil was moist) throughout May and early June when
there was river flow and a healthy water table associated with that flow. In
late June, heavy groundwater pumping by Cal Am drew down the water table in the
area, river flow subsequently ceased, and the soil dried out (see Figure 7).
Soil tension at the toe tensiometer stations (near the river) rose abruptly
from »0.10 bars to »0.80 bars-
the wilting point for most plants. Dryness values remained high until late
October when it finally rained.
Values
for terrace tensiometers at the Valley Hills Monitoring site (Figure 10) do not
reflect the actual dryness experienced by nearby monitoring trees. These
tensiometers would not hold a vacuum at all from mid-August until the late
October rains. This could be attributed to extreme tension of which would be
powerful enough to break seals on the tensiometers, air spaces around the shaft
of the tensiometer, or that conditions were drier than these tensiometers are
designed to operate in. Tensiometers can also fail when all of the liquid is
completely sucked out of the vacuum shaft and it can no longer hold a vacuum.
Tensiometer failures can be seen in discontinuous data in the plots of Figures
9 & 11 as well. These failures all have been on terrace tensiometers where
the soil is drier.
Table
2 is a summary of pre-dawn moisture potential readings for all four sites. The average annual reading for willows and
cottonwoods as well as the highest reading for each tree at each site is given.
Table 2. Average Pre-Dawn Leaf Water Potential Summary 2004

Pre-dawn
leaf water potential monitoring is a valuable tool in monitoring vegetation
stress within the riparian corridor.
Pre-dawn leaf water potential readings of 7.5 bars or greater indicate
water stress in willows and values of 10.0 bars or greater indicate water
stress in cottonwoods (McNiesh, 1988).
Pre-dawn
leaf water potential values fluctuate naturally due to weather. For example,
values tend to drop during periods of heavy fog. Because the vegetation
monitoring sites are all located within several miles of the coast, periods of
heavy fog in lower
The
Similar
patterns are shown in Figures 12 and 14, pre-dawn leaf water potential rises
sharply as the depth to groundwater falls subsequent to the river drying. Note
that the river dries from downstream to upstream as the groundwater, which
provides the support for the surface flow, is diverted by production wells. In
order from lowest to highest the river dries (and groundwater falls) first at
the Cañada site, then at

Figure
12. Plant Stress Correlated with Groundwater Availability at the Rancho Cañada
Site
Figure 13. Plant
Stress Correlated with Groundwater Availability at the

Figure 14. Plant Stress Correlated with Groundwater Availability at the Schulte Site
Historic
depth to groundwater values from 1988 through 2004 were plotted for six monitoring
well sites; de Dampierre, Coyote, Reimers,
With the exception of the irrigated ‘control’ trees, all monitoring trees
(those that are analyzed for plant moisture stress) are removed from
irrigation, though may be under the influence of irrigation from neighboring
trees. These trees are removed from irrigation for two reasons; to measure how
the trees respond to drops in the water table without the irrigation, and to
gauge how the trees will respond to weaning them off irrigation.
In drier years, monitoring trees have suffered moisture stress to the
point of fatality, either directly from desiccation or indirectly from disease
resulting from lack of water. In several instances another tree was chosen to
study so that the dying tree could be removed from the monitoring program and
returned to the irrigation regime. Overall, mortality rates are higher for
trees planted at the higher elevations above the river channel (also referred
to as the terrace).
As shown in Figures 15 & 16, trees irrigated weekly (‘control’ trees)
show less stress than unirrigated trees. At the Schulte site average irrigated
cottonwood stress was 2.69 bars versus 4.21 bars for the average unirrigated
cottonwood; this shows 36% less plant moisture stress.

Figure 15. Effects of Irrigation on Monitored Trees at the Schulte Monitoring Site

Figure 16. Effects of Irrigation on Monitored Trees at the Valley Hills Monitoring Site
V. DISCUSSION
Many complex interacting factors influence the moisture stress
experienced by riparian vegetation.
Factors that impact riparian monitoring results include depth to
groundwater, which is influenced by weather, precipitation, river flow, and
groundwater pumping. This in turn impacts soil moisture. To complicate things
further, different soils have different water holding capacities. Finer
textured soils (clay) hold more water than coarse textured soils (sand).
Therefore, directly measuring plant stress helps integrate the various driving
forces. However, it is important to note
that there is a lag time associated with a change in depth to groundwater and
moisture stress in individual plants. Plant available moisture is a function of
matric potential (capillary and surface binding forces), osmotic potential
produced by solutes in the soil water, gravitational forces, and external
pressure (Kramer, 1995). As the water table drops, residual moisture in the
soil still provides water for a limited time to plants.
Production wells in
Draw down on the Carmel River peaked at the Cañada Well with a 1.86 foot
drop in the water table (3.72 ft drop for a two week period June 4-18, 2004).
Other studies show that on coarse substrates in dry regions, early
establishment and growth of Populus spp. seedlings may require water
tables within 3.3-6.6 feet of the established surface (McBride and Strahan,
1984, Mahoney and Rood, 1992, Stromberg et. al, 1996). Root growth of established trees allows
survival during gradual water table decline.
Mature trees are more suited to withstand channel incision and flood
plain isolation (Everitt, 1968).
Cottonwoods typically grow where the depth to the water table is 11.5
feet (Busch et. al. 1995, Scott et. al. 1997, Stromberg et. al. 1997), although
cottonwoods have been observed to exist in areas where the water table is 23 to
30 feet deep. The
Obtaining
an accurate characterization of soil moisture can be difficult in alluvial
areas. In the past MPWMD used a neutron
probe to test soil moisture in riparian areas. This system was complicated
because it depended on radioactive equipment and a special license. Currently
MPWMD uses tensiometers that are limited in that they are difficult to install
deeper than 3 feet and are designed for homogenous agricultural soils. Working
with tensiometers in gravel and sandy areas give a relative indication of soil
drying and wetting. The ideal tensiometer range is 0.0 to 0.5 bars with a peak
of 0.8 bars. Highly stressed vegetation
exceeds the potential of this tool. Pre-dawn
leaf moisture potential laboratory testing results indicate that the vegetation
wilting point is reached at 15 bars and 0.3 bars indicates field capacity or
total soil saturation. This range varies according to soil type and plant type
(Kramer and Boyer, 1995). As a result, the plant moisture stress methodology
can provide information concerning riparian vegetation stress.
During the
2004 water year, the total annual rainfall was 18.16 inches at the San Clemente
Dam, located mid-watershed.
Precipitation for this season was 85 percent of normal (21.37 inches is
the average annual rainfall at
In 2004 MPWMD
irrigated ten project areas (de Dampierre, Trail and Saddle Club, Scarlett,
Begonia, Schulte South,
VIII. REFERENCES
Boyer, J. S. 1995. Measuring the
water status of plants and soil. Academic Press,
Busch, D. E. and S. D. Bradley. 1995. Mechanisms associated with decline of woody species in riparian ecosystems of the Southwestern U.S. Ecological Monographs 65(3): 347-370.
Christensen,
T. 2001. MPWMD Staff Notes.
Everitt, B. L. 1995. Hydrologic
factors in regeneration of
James, G. 1999. Carmel River Basin – Surface Water
Resources Data Report, Water Years 1996-1999, Monterey Peninsula Water Management
District, December 1999.
James, G. 2003. Carmel River Basin – Surface Water
Resources Data Report, Water Years 2000-2003, Monterey Peninsula Water
Management District, January 2004.
Kramer,
P.J. 1995. Water Relations of Plants. Academic Press,
Mahoney, J. M. and S. B. Rood. 1992.
Response of a hybrid poplar to water table decline in different substrates.
McBride, J. R. and J. Strahan. 1984.
Establishment and survival of wood riparian species on gravel bars of an
intermittent stream. American
McNeish,
C.M. 1988. A methodology for predicting riparian
vegetation impacts due to pumping the Carmel Valley Aquifer. Unpublished report to the MPWMD.
McNeish, Charles. 1988. The
Effects of Groundwater Pumping on Riparian Vegetation: Carmel Valley-Draft,
Dec. 1988
McNeish,
C.M. 1986. Effects of production well pumping on plant
water stress in the riparian corridor of the lower
MPWMD.
1993.
MPWMD.
1997. California-American Water Company Production Wells and Pumping Capacities.
October, 1997 (except San Carlos Well that reflects the 1999 well replacement).
Table Compiled.
Page,
G. and Matthews, G. 1984.
Scott,
M. L. 1997. Responses of Riparian cottonwoods to Alluvial Water Table
Declines. Environmental Management Vol.
23, No. 3 pp. 347-358.
Scott, M. L., G. T. Abule, and J. M.
Friedman. 1997. Flood dependency of cottonwood establishment along the Missouri
River,
Stromberg, J. C., Tiller, R., and Richter, B. 1996. Effects of groundwater decline on riparian vegetation of semiarid regions: The San Pedro, Arizona. Ecological Applications 6: 113-131.
Woodhouse,
Dr. R. 1983. Baseline analysis of the
riparian vegetation in the lower
APPENDIX A: Historical Depth to Groundwater for Selected Monitoring Wells