|
ITEM: |
INFORMATIONAL
ITEMS/STAFF REPORTS |
|||||
|
|
||||||
|
20. |
SEMI-ANNUAL GROUNDWATER
QUALITY MONITORING REPORT |
|||||
|
|
||||||
|
Meeting
Date: |
February 22, 2007 |
Budgeted: |
Yes |
|||
|
|
||||||
|
From: |
David A.
Berger, |
Program/ |
Hydrologic Monitoring 2.6 |
|||
|
|
General
Manager |
Line Item No.: |
2-6-1 G, and 2-6-2 D |
|||
|
|
||||||
|
Prepared
By: |
Joe Oliver/ |
Cost Estimate: |
N/A |
|||
|
|
Tom Lindberg |
|||||
|
|
||||||
General Counsel Approval: N/A |
||||||
Committee Recommendation: N/A |
||||||
|
CEQA Compliance: N/A |
||||||
SUMMARY: Water quality results from the Fall 2006 sampling of the Monterey Peninsula Water Management District’s (District’s) monitor well networks in the Carmel Valley aquifer and the coastal areas of the Seaside Ground Water Basin are presented and briefly summarized below.
BACKGROUND: The District has maintained a groundwater quality monitoring program in the Carmel Valley Aquifer since 1981, and in the Seaside Groundwater Basin since 1990. Currently, collection of samples from the Carmel Valley monitor wells is conducted on an annual basis. The sampling schedule for Carmel Valley is staggered, with upper valley wells (i.e., upgradient of the Narrows), sampled in Spring and lower Carmel Valley wells in Fall, to coincide with the historically higher nitrate concentrations in these respective areas. Collection of samples from the Seaside Basin monitor wells is conducted once per year in Fall, coinciding with the historically low water levels in the basin at this time of the year. It should be noted that recently the District has been retained by the Seaside Basin Watermaster to collect water quality samples from the District’s Seaside Basin coastal monitor well network on a quarterly basis. These results will be reported to the Seaside Basin Watermaster Board on a quarterly basis.
DISCUSSION/ANALYSIS:
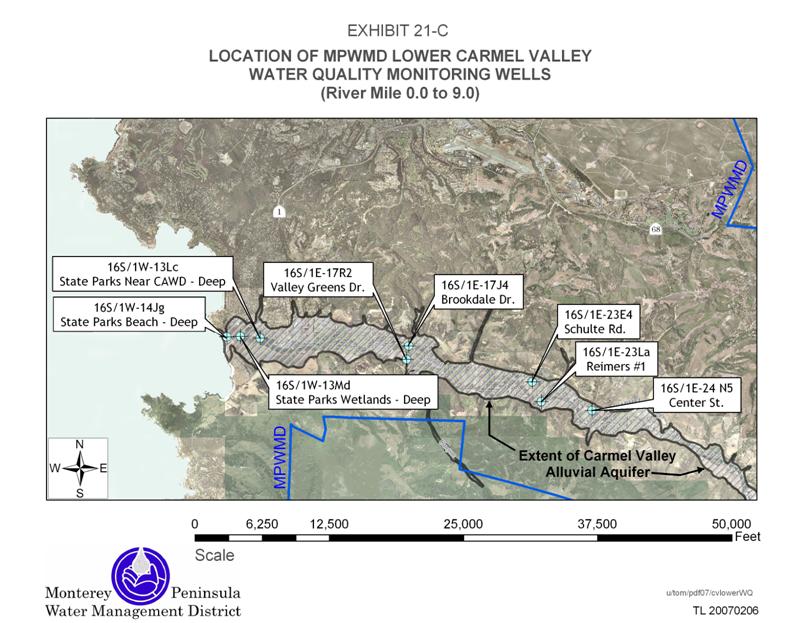
Carmel Valley Aquifer Monitor Wells - Results from the Fall 2006 sampling are provided in Exhibit 20-A. Eight monitor wells in the lower Carmel Valley were sampled during Fall 2006, as per the sampling schedule described above. The locations of these sampling points are shown on the map in Exhibit 20-C. Review of these water quality results indicates that, in general, there are minor changes in overall water quality compared to samples collected in Fall 2005 (data reported in the February 23, 2006 Board packet and provided here in Exhibit 20-B). Staff is particularly interested in tracking indicators of potential seawater intrusion in the coastal portion of Carmel Valley. Accordingly, three sets of wells were established west of Highway 1, with each set being made up of three wells completed at different depths. Review of historical data indicated that the shallower and intermediate wells in the coastal area are subject to the mixing of fresh water and saline water as high tides and surf overtop the sand berm between the lagoon and the ocean. This contributes to episodic mixing within the shallower and intermediate zones of the aquifer, but is not necessarily representative of larger-scale potential seawater intrusion into the aquifer. Currently, only the deeper wells at each of the three coastal locations are sampled.
Graphs showing historical specific electrical conductance (SEC) and chloride concentration in the deepest wells at each of the three coastal well sites are shown in Exhibits 20-E, 20-F, and 20-G. Note that the scales on the vertical axes of these graphs are different to help discern trends in the data. Well 16S/1W-14Jg is the deepest in the array of three wells located at the Carmel River State Beach parking lot at River Mile (RM) 0.07 (approximately 375 feet from the shoreline). Exhibit 20-E shows that SEC and chloride concentration noticeably increased in this well in 2006 for the second year in row, but these levels have not approached the levels observed at this location in the early 1990’s. These higher values observed early in the period of record at this site are at least partially attributable to the fact that there was no fresh water surface inflow to the lagoon for approximately four years (April 1987 until March 1991). This lack of freshwater inflow for local ground water recharge, combined with the proximity to the ocean and the permeability of the alluvial sediments, allowed for inland movement of the freshwater / seawater interface past this site near the end of the 1987 – 1991 drought period.
Graphs of water quality data at the two coastal sites located farther from the shoreline show that SEC and chloride concentration slightly decreased from 2005 to 2006 at well 16S/1W-13Md, located at RM 0.31 from the shoreline (Exhibit 20-G), and increased slightly from 2005 to 2006 at well 16S/1W-13Lc, located at RM 0.65 (Exhibit 20-F). At both sites, there does appear to be a slight trend toward increased levels over the period of record. As noted in a prior report, the anomalously high SEC and chloride concentration in well 16S/1W-13Lc in 2000 are suspicious (Exhibit 20-F). Additional background on historical water quality at the coastal monitor well sites can be found in District Technical Memorandum 90-04, Summary of Carmel Valley Groundwater Quality from Coastal Monitor Wells, which is available at the District office. Staff will continue to track future results for trends that might indicate significant changes in concentrations of these or other constituents in the coastal area of the aquifer.
For the five wells located farther inland, changes in SEC and chloride concentration did not vary significantly from the previous year’s sample results. The graph in Exhibit 20-H shows SEC and chloride concentration in well 16S/1E-23La, located at RM 6.72. The increased levels of SEC and chloride concentration that were observed in this well in 2005 had returned nearly to 2004 levels. The high chloride concentration in well number 16S/1E-23La in Spring 1993 is anomalous. Staff will continue to track future results for trends.
One other well, 16S/1E-23E4, located at RM 6.53, yielded anomalous results for a number of constituents in 2006, most notably the concentration of iron. It is noted that during the intervening year since this well was last sampled, the wellhead had been covered with debris from construction activities in the vicinity and the area had been flooded with runoff from Schulte Road. It should also be noted that the battery-powered pump that is used to flush the well casing and obtain samples was not operating to its optimum capacity at this site when it was sampled in 2006. It is likely that the well was contaminated by surface runoff and that the well was not fully evacuated of the standard three casing volumes prior to sampling. Extra effort will be employed at this site in the future to ensure the restoration of this well and the reliability of data acquired.
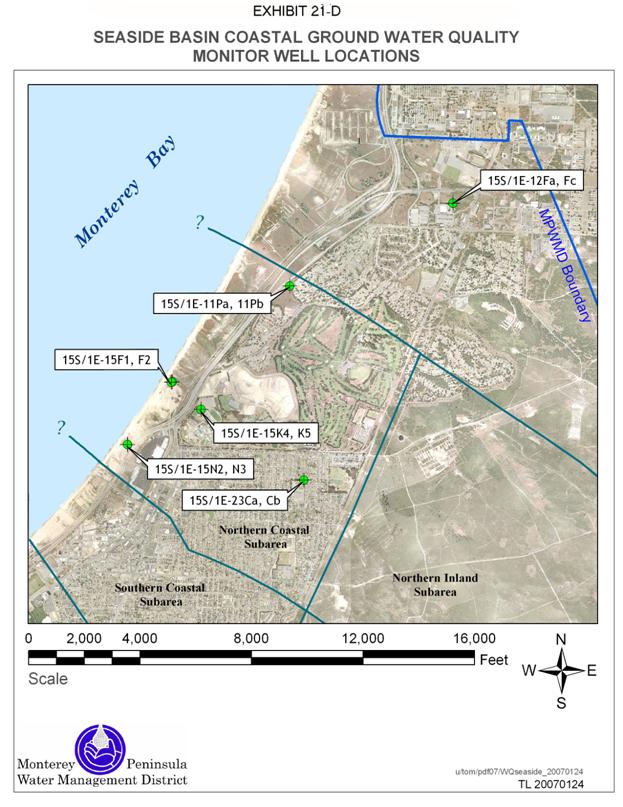
Seaside Groundwater Basin Coastal Monitor Wells - Since 1990, the District has been collecting water quality samples from coastal monitor wells in the Seaside Groundwater Basin, for the purposes of water quality characterization and sea-water intrusion monitoring. In Fall 2006, 12 dedicated monitor wells at six different sites were sampled. Results of water quality sampling from Fall 2006 and Fall 2005 for the Seaside wells are provided in Exhibit 20-A and Exhibit 20-B, respectively. The locations of the Seaside wells are shown on the map in Exhibit 20-D. These results indicate little change from previous results over the period of record for the existing wells, and that there is no indication of sea-water intrusion in the two principal aquifer units -- the Paso Robles Formation (i.e., shallower unit) and Santa Margarita Sandstone (i.e., deeper unit) -- in this area of the Seaside Groundwater Basin at the present time. A graph showing the historical period of record for SEC and chloride concentration at a representative pair of coastal monitor wells is presented in Exhibit 20-I. Results for SEC were slightly lower or unchanged in every well relative to 2005, with two exceptions. SEC for wells 15S/1E-23Cb and 15S/1E-15F2 was slightly higher in 2006 relative to 2005. No remarkable changes were detected in other constituent concentrations for any wells in the area. Staff will continue to track results for trends that might indicate significant changes in any wells in the basin. A more complete historical summary of the Seaside Basin coastal groundwater quality data is contained in District Technical Memorandum 97-02 Seaside Basin Coastal Monitor Wells: Ground Water Quality Monitoring Results, 1990-1996, which is available at the District office.
EXHIBITS
20-A Ground Water Quality Monitoring Results - Fall 2006
20-B Ground Water Quality Monitoring Results - Fall 2005
20-C Location of MPWMD Carmel Valley Water Quality Monitoring Wells
20-D Location of MPWMD Seaside Basin Water Quality Monitoring Wells
20-E Water Quality Results in Well 16S/1W-14Jg in Carmel Valley
20-F Water Quality Results in Well 16S/1W-13Lc in Carmel Valley
20-G Water Quality Results in Well 16S/1W-13Md in Carmel Valley
20-H Water Quality Results in Well 16S/1E-23La in Carmel Valley
20-I Water Quality Results in Wells 15S/1E-15N2 and -15N3 in Seaside Coastal Subareas
U:\staff\word\boardpacket\2007\2007boardpackets\20070222\InfoReports\20\item20.doc